
Every smart business decision begins with a question. Is this market worth entering? Is now the right time to invest? Can this company sustain growth? These are the kinds of questions that financial ratios help you answer. When you combine ratio analysis with market opportunity thinking, you gain a powerful lens. You can see beyond the surface numbers and spot real business potential before others do.
This article will walk you through how to use financial ratios to analyze market opportunities deeply. You will learn which ratios matter most, how to read them correctly, and how to apply them in real investment and business scenarios.
What Is Market Opportunity Analysis?
Market opportunity analysis is the process of evaluating whether a particular market, industry, or company presents a valuable business or investment prospect. It looks at growth potential, competitive strength, and financial health together.
However, most people stop at surface-level metrics. They look at revenue or user numbers and call it done. A deeper analysis goes further. It uses financial ratios to measure the actual economic strength behind those numbers. Therefore, ratio analysis becomes the backbone of any serious market opportunity study.
Why Financial Ratios Matter in Market Analysis
Financial ratios translate raw numbers into meaningful insights. A company may report $500 million in revenue, but that alone tells you very little. Is the company profitable? Can it pay its debts? Is it growing efficiently? Ratios answer all of these questions.
Additionally, ratios allow you to compare companies across different sizes and industries. You can benchmark one firm against its peers. You can also track how a single company changes over time. This flexibility makes ratios one of the most useful tools in any analyst’s toolkit.
Key Categories of Financial Ratios for Opportunity Analysis
To analyze a market opportunity deeply, you need to understand five main categories of financial ratios. Each one reveals a different layer of business performance.
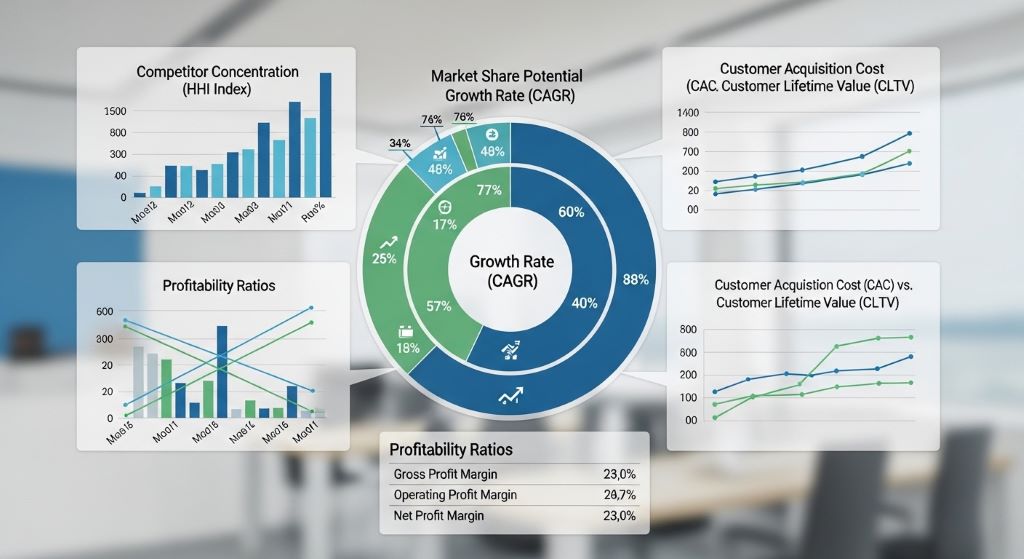
Profitability Ratios
Profitability ratios show whether a company earns enough money relative to its costs and assets. These are often the first stop for investors.
The gross profit margin reveals how much money a company keeps after paying for the cost of goods sold. A high and rising gross margin often signals a strong market position. The net profit margin goes one step further. It shows what is left after all expenses, taxes, and interest are paid.
Return on equity (ROE) is another key metric. It measures how much profit a company generates from shareholder funds. A high ROE, especially when compared to industry peers, often points to a company with real competitive advantage.
Therefore, when evaluating a market opportunity, look for companies in that space with strong and consistent profitability ratios. These suggest the market can support healthy margins.
Liquidity Ratios
Liquidity ratios measure how easily a company can meet its short-term obligations. They are a signal of financial stability.
The current ratio divides current assets by current liabilities. A ratio above 1.5 is generally seen as healthy. The quick ratio is stricter. It removes inventory from the calculation. This gives a clearer picture of immediate cash availability.
However, liquidity is not just about safety. In market analysis, companies with strong liquidity have the flexibility to invest in new products, expand into new regions, or weather economic downturns. This resilience matters when you are assessing long-term opportunity.
Leverage or Debt Ratios
Leverage ratios show how much debt a company carries relative to its equity or assets. Too much debt can limit a company’s ability to grow and innovate.
The debt-to-equity ratio is the most common here. A lower ratio generally means less financial risk. The interest coverage ratio shows how comfortably a company can pay interest on its debt. A ratio below 1.5 is a warning sign.
When you are analyzing a market opportunity, industries with very high average debt levels may face structural challenges. Additionally, companies in those markets may be unable to invest aggressively in growth. Therefore, leverage ratios help you understand not just individual companies, but the financial culture of an entire industry.
Efficiency Ratios
Efficiency ratios reveal how well a company uses its resources to generate revenue. These ratios are particularly useful when comparing companies within the same market.
The asset turnover ratio shows how much revenue a company generates per dollar of assets. A higher number means better efficiency. The inventory turnover ratio measures how quickly a company sells its inventory. High inventory turnover in a growing market often means strong demand.
Furthermore, receivables turnover tells you how fast customers pay their bills. Slow collection can create cash flow problems, even in otherwise profitable companies. When a market shows consistently high efficiency ratios, it is a sign that businesses in that space are well-managed and operationally mature.
Valuation Ratios
Valuation ratios help you understand whether a market opportunity is priced fairly or whether you are overpaying to enter it.
The price-to-earnings (P/E) ratio is the most widely used. A very high P/E may indicate that a market is overheated. The price-to-book (P/B) ratio compares market value to the accounting value of assets. A low P/B in a growing market may signal an undervalued opportunity.
Additionally, the enterprise value to EBITDA (EV/EBITDA) ratio is widely used in mergers and acquisitions. It gives a cleaner picture of value by stripping out taxes and non-cash charges. Therefore, when scouting market entry or investment opportunities, valuation ratios help ensure you are not paying too much for what you are getting.

How to Build a Ratio-Based Market Opportunity Framework
Now that you understand the key ratios, you need a structured approach to using them in market analysis. Here is a simple but effective framework.
Step One: Define the Market
Start by identifying the industry or sector you are analyzing. Look at publicly listed companies in that space. Gather their financial statements for at least three to five years.
Step Two: Calculate and Compare
Calculate the key ratios for each company. Then compare them across the industry. Look for averages and outliers. A company with much better ratios than its peers may be a strong market player. Alternatively, it may indicate an inefficiency in the broader market that others have not yet exploited.
Step Three: Track Trends Over Time
A single year of data can be misleading. However, a five-year trend tells a story. Look for companies or markets where margins are expanding, debt is falling, and efficiency is improving. These trends often predict future opportunity.
Step Four: Combine Ratios with Qualitative Data
Ratios alone are not enough. You should pair them with information about market size, regulatory environment, consumer trends, and competitive dynamics. Therefore, think of ratios as your quantitative foundation and qualitative research as the structure you build on top of it.
Common Mistakes in Ratio-Based Market Analysis
Many analysts make the same errors when using ratios. Understanding these pitfalls can save you from costly decisions.
One common mistake is comparing ratios across different industries. A high debt-to-equity ratio might be normal in banking but alarming in retail. Always compare within the same sector.
Another mistake is ignoring context. A company with a falling gross margin may be in trouble, or it may be in a period of strategic investment. Therefore, always dig deeper before drawing conclusions.
Additionally, relying on a single ratio is risky. No single number tells the whole story. Use multiple ratios together to build a complete picture.
Real-World Application: Analyzing a Tech Market Opportunity
Suppose you are exploring the cloud software market as a business opportunity. You might start by looking at the gross margins of leading players. Many mature SaaS companies report margins above 70 percent. This signals a healthy, scalable market.
Next, you check their P/E ratios. If they are very high, the market may be expensive to enter via acquisition but might still offer room for organic growth. You then examine efficiency ratios. High asset turnover suggests companies are extracting strong value from their investments.
Furthermore, you look at liquidity ratios. Companies with strong cash positions have the ability to invest in customer acquisition and R&D. This suggests the market is still growing. Finally, you examine debt levels. If most players operate with low leverage, it signals a financially healthy ecosystem.
However, if you find a niche within that market where margins are lower but growing, debt is manageable, and valuation is modest, that combination may reveal a hidden opportunity that others have overlooked.
Conclusion
Using financial ratios to analyze market opportunities is not about memorizing formulas. It is about asking the right questions and knowing where to look for answers. Profitability ratios show if a market is economically attractive. Liquidity ratios reveal financial stability. Leverage ratios uncover risk. Efficiency ratios measure operational quality. Valuation ratios tell you if the opportunity is fairly priced.
Together, these tools form a powerful framework for evaluating markets deeply and confidently. Additionally, when you pair ratio analysis with qualitative research and trend tracking, you gain a well-rounded view of any opportunity. Therefore, whether you are an investor, entrepreneur, or business strategist, mastering ratio-based market analysis is a skill that pays dividends for the long term.
Frequently Asked Questions
What is the most important financial ratio for market opportunity analysis?
There is no single most important ratio. However, profitability ratios like gross margin and ROE are often the starting point. They quickly show whether a market can support strong business economics.
Can financial ratios be used to compare companies in different countries?
Yes, but with caution. Accounting standards can differ across countries. Additionally, tax environments and capital structures vary widely. Therefore, always account for these differences when making cross-border comparisons.
How many years of data should I use when analyzing ratios for market opportunities?
A minimum of three years is recommended. Five years is better. This allows you to identify genuine trends rather than short-term anomalies.
Are high P/E ratios always a warning sign?
Not necessarily. A high P/E often reflects strong growth expectations. However, when P/E ratios are high across an entire industry, it may signal that the market is overvalued. Therefore, context matters greatly.
How do I use ratio analysis if a company is not yet profitable?
For pre-profit companies, focus on revenue growth rate, gross margin trajectory, and cash burn rate. Additionally, the price-to-sales ratio becomes more useful than P/E in early-stage market analysis.
Related Topics:
Fake Meat on Stock Market Investment Risk Analysis
Santiago Stock Exchange: Opening auction and closing auction